Curator is an index management tool provided by open source Elasticsearch. This tool allows you to create, delete, and disable indexes. It also allows you to merge index segments.
This blog postdescribes how to install Curator and how to delete old indices based on time.
Installing Curator
pip3 install elasticsearch-curator
Check curator version
curator --version
Note: If you encounter this error while installing.
ERROR: Cannot uninstall ‘PyYAML’. It is a distutils installed project and thus we cannot accurately determine which files belong to it which would lead to only a partial uninstall.
Execute the command below to fix it.
sudo -H pip3 install --ignore-installed PyYAML
Create a curator.yml file
In this file, indicate the host, port, username, and password.
# Remember, leave a key empty if there is no value.  None will be a string,
# not a Python "NoneType"
client:
  hosts:
    - 192.168.1.1
  port: 9200
  url_prefix:
  use_ssl: False
  certificate:
  client_cert:
  client_key:
  ssl_no_validate: False
  username: elastic
  password: Password
  timeout: 30
  master_only: False

logging:
  loglevel: INFO
  logfile:
  logformat: default
  blacklist: ['elasticsearch', 'urllib3']
The example configuration below will delete indices with a prefix pattern basketbal-scores- (full index format: basketbal-scores-2022.04.01) older than 14 days.
---
actions:
  1:
    action: delete_indices
    description: >-
      Delete indices older than 14 days (based on index name), for logstash-
      prefixed indices. Ignore the error if the filter does not result in an
      actionable list of indices (ignore_empty_list) and exit cleanly.
    options:
      ignore_empty_list: True
      timeout_override:
      continue_if_exception: False
      disable_action: False
    filters:
    - filtertype: pattern
      kind: prefix
      value: basketbal-scores-
      exclude:
    - filtertype: age
      source: name
      direction: older
      timestring: '%Y.%m.%d'
      unit: days
      unit_count: 14
      exclude:
# Housekeep indices more than 14 days
0 0 * * * /usr/local/bin/curator /home/scripts/delete_indices_time_base.yml --config /home/scripts/curator.yml >> /home/scripts/log/curator_purging_time_base.log 2>&1
This blog describes the steps to create and deploy Redis Enterprise Cloud Subscription and Databases as code on GCP.
Install Terraform in a centos VM. If you want to test the connection with the Redis private endpoint in the same VM after provisioning the databases, then use a VM that is part of the VPC network that you want to peer with Redis Enterprise later.
# You may get the values of api_key and secret_key (Also known as API user keys) by following the steps from this site https://docs.redis.com/latest/rc/api/get-started/manage-api-keys/#:~:text=Sign%20in%20to%20your%20Redis,select%20the%20API%20Keys%20tab
variable "api_key" {
  type = string
  default = "<my_api_key>"
}


variable "secret_key" {
  type = string
  default = "<my_secret_key>"
}


# Project name as Prefix of the Redis instance
# Example: "${projname}-gacc-cache-redis"
variable "projname" {
  type = string
  default = "test-project"
}

variable "region" {
  type = string
  default = "us-west1"
}

variable "preferred_zones" {
  type = string
  default = "us-west1-a"
}

variable "multiple_zones" {
  type = bool
  default = false
}

variable "cidr" {
  type = string
  default = "192.168.1.0/24"
}
main.tf
# Generates a random password for the database
resource "random_password" "passwords" {
 count = 3   # this number should be equal to the number of Redis database to be created
 length = 20
 upper = true
 lower = true
 numeric = true
 special = false
}

resource "rediscloud_subscription" "MY-REDISCLOUD-SUBSCRIPTION" {
 name = "My-Redis-Subscription"
 memory_storage = "ram"

 cloud_provider {
   # Running in GCP on Redis resources
   provider = "GCP"
   region {
     region = "${var.region}"
     networking_deployment_cidr = "${var.cidr}"
     preferred_availability_zones = ["${var.preferred_zones}"]
     multiple_availability_zones  = "${var.multiple_zones}"
   }
 }

  database {
   name = "${var.projname}-redis-database1"
   protocol = "redis"
   memory_limit_in_gb = 6
   replication = true
   data_persistence = "none"
   throughput_measurement_by = "operations-per-second"
   throughput_measurement_value = 10000
   password = random_password.passwords[0].result
   alert {
      name = "dataset-size"
      value = 80
    }
   alert {
      name = "throughput-higher-than"
      value = 10000
    }
 }

  database {
   name = "${var.projname}-redis-database2"
   protocol = "redis"
   memory_limit_in_gb = 6
   replication = true
   data_persistence = "none"
   throughput_measurement_by = "operations-per-second"
   throughput_measurement_value = 10000
   password = random_password.passwords[1].result
   alert {
      name = "dataset-size"
      value = 80
    }
   alert {
      name = "throughput-higher-than"
      value = 10000
    }
 }

 database {
   name = "${var.projname}-redis-database3"
   protocol = "redis"
   memory_limit_in_gb = 13
   replication = true
   data_persistence = "aof-every-1-second"
   throughput_measurement_by = "number-of-shards"
   throughput_measurement_value = 4
   password = random_password.passwords[2].result
   alert {
      name = "dataset-size"
      value = 80
    }
   alert {
      name = "throughput-higher-than"
      value = 10000
    }
 }

}
outputs.tf
# Terraform output values

output "database_private_endpoints" {
    description = "Output private endpoints"
    sensitive = true
    value = {
    for database in rediscloud_subscription.MY-REDISCLOUD-SUBSCRIPTION.database:
    database.name => database.private_endpoint}
}

output "database_passwords" {
    description = "Output passwords"
    sensitive = true
    value = {
    for database in rediscloud_subscription.MY-REDISCLOUD-SUBSCRIPTION.database:
    database.name => database.password}
}
Few Notes
Update Redis Enterprise Cloud API Keys in variables.tf
You can get the values of api_key and secret_key (Also known as API user keys) by following the steps from this site.
The Account key identifies the account associated with the Redis Enterprise Cloud subscription.
The User key (secret_key) identifies the user and (optionally) the context of a request. Generated by account owners.
In main.tf file, add database blocks with configuration based on application requirements.
Example:
Also in the main.tf, edit the count parameter under random_password resource. The number should be equal to the number of Redis instance to be created.
Executing Terraform Commands To Create Redis Enterprise Databases
Execute terraform init command to initialize a working directory containing Terraform configuration files.
terraform init
Run terraform plan command to create an execution plan, which lets you preview the changes that Terraform plans to make to your infrastructure.
terraform plan
If the plan is okay, then execute terraform apply.
terraform apply
Outputting sensitive data
The database_private_endpoints and database_passwords are sensitive data. So, the contents will not be instantly outputted after executing terraform apply.
Google Cloud VPC Network Peering allows internal IP address connectivity across two Virtual Private Cloud (VPC) networks regardless of whether they belong to the same project or the same organization.
In your Redis subscription, Go to Connectivty tab, then click + Add peering.
Provide Project ID and Network Name. Then Copy the Google cloud command.
Click Initiate peering.
In GCP console, open cloud a cloud shell, then execute the command you just copied.
Configure your GCP project and region.
gcloud config set core/project
gcloud config set compute/zone zone
Execute the command to accept VPC Peering. This is the Google cloud command you copied from Redis Enterprise portal.
In this blog post, I’m gonna talk about MySQL Memory Issues. What causes High memory usage and what is the impact on MySQL database instances.
But first, we can do a quick review on the following topics:
How MySQL uses memory? (Log files, buffers, InnoDB buffer pool size)
How MySQL allocates memory?
Swap memory
Troubleshooting
Best practices.
Globally shared memory is allocated upon the creation of an instance and is shared by all connections Example: thread cache, query cache, buffer pool, and log buffer.
Private memory is used to allocate cache upon connection to MySQL server. It is allocated for each thread. For example; sort buffer, join buffer, and temporary table.
InnoDB maintains one or more buffer pools that cache frequently used data and indexes in the main memory.
So, when a read query is executed from the client program, InnoDB checks to see if the required data pages are in the buffer pool. If it is not in the buffer pool, InnoDB requests the data from the tablespace. Then it will put the data pages in the buffer pool. And then, MySQL will return the results to the client.
When transactions are performed, data changes are written to the log buffer in memory. then every time a transaction is committed, the transaction logs get flushed to the disk, but this behavior can be changed (InnoDB_flush_log_at_trx_commit). If a crash occurs (while the tables are being modified), the redo log files are used for recovery.
On the other hand, Dirty pages in the buffer pool get written to the disk at checkpoints. This is to ensure that the cache has enough free space.
innodb_buffer_pool_size is the most important tuning parameter. It caches table and index data. The buffer pool permits frequently used data to be accessed directly from memory, which speeds up processing.
Setting it too low can degrade the performance. Setting it too high can increase the memory consumption causing the DB to crash.
MySQL allocation is not only from innodb_buffer_pool_size, but also from other buffers in the database such sort_buffer_size, read_buffer_size, read_rnd_buffer, join_buffer_size, and tmp_table_size and this will require additional 5-10% extra memory
Below is a formula to calculate the approximate memory usage for your MySQL:
Maximum MySQL Memory Usage = innodb_buffer_pool_size + key_buffer_size + ((read_buffer_size + read_rnd_buffer_size + sort_buffer_size + join_buffer_size) X max_connections)
Swapping can happen when a system requires more memory than is allocated .A large buffer may lead to swapping in the operating system and make the performance slow.
To avoid your MySQL/MariaDB data being SWAP instead of RAM, you have to play with a kernel parameter called swappiness.
A swappiness value is used to change the balance between swapping out runtimememory and dropping pages from the system page cache. The higher the value, the more the system will swap. The lower the value, the less the system will swap. The maximum value is 100, the minimum is 0, and 60 is the default.
I performed a test in AWS RDS MySQL. I ran a stored procedure that consumed a lot of memory until the server crashed. We will notice that when memory gets low, Swap usage will increase. We will also see a spike in disk IO usage.
When MySQL crashed, we will lose connection to the database. In AWS RDS, we can see the logs and EVENTs to identify the cause of the crash. The log indicates that the database process was killed by the OS due to excessive memory consumption.
I also did the same test in Azure MySQL. The difference between Azure and AWS is that when the DB crash, in Azure, it will failover to the Standby replica, but in AWS, a mysqld process crash would not trigger a failover.
In Azure, under Private DNS Zone, if we see that the IP address changed, then it means that it failed over to the standby replica successfully.
To block all write access and to mark all tables as ‘properly closed’ on disk, we execute the FLUSH TABLES WITH READ LOCK. Note that the tables can still be used for read operations. Open tables will be closed and all tables will be locked for all databases with a global lock.
FLUSH TABLES and RELOAD privilege are required to execute this operation.
To release the lock, you may use UNLOCK TABLES, which implicitly commits any active transaction only if any tables currently have been locked with the LOCK TABLES. If the UNLOCK TABLES is executed after FLUSH TABLES WITH READ LOCK, then the commit will not occur because FLUSH TABLES WITH READ LOCK does not acquire table locks.
The Redis Data Source for Grafana is a plugin that allows users to connect to any Redis database On-Premises and in the Cloud. It provides out-of-the-box predefined dashboards and lets you build customized dashboards to monitor Redis and application data.
grafana-cli plugins install redis-datasource
Start Grafana
Start Grafana.
sudo systemctl start grafana-server.service
Check Grafana Status.
sudo systemctl status grafana-server.service
Access Grafana Monitor Dashboard
Paste the server’s IP, plus port 3000 on your web browser to access Grafana Dashboar<Ipd.
<ServerIPaddress>:3000
The initial username and password is admin/admin.
Configure Data source
Go to Configuration > Data sources.
Add data source.
Search for “Redis“, then select the data source below.
This blog post describes how to deploy a TiDB cluster on GCP Google Kubernetes Engine (GKE). TiDB on Kubernetes is the standard way to deploy TiDB on public clouds.
TiDB Architecture
TiDB is designed to consist of multiple components. These components communicate with each other and form a complete TiDB system. The architecture is as follows:
TiDB server
The TiDB server is a stateless SQL layer that exposes the connection endpoint of the MySQL protocol to the outside. The TiDB server receives SQL requests, performs SQL parsing and optimization, and ultimately generates a distributed execution plan. It is horizontally scalable and provides the unified interface to the outside through the load balancing components such as Linux Virtual Server (LVS), HAProxy, or F5. It does not store data and is only for computing and SQL analyzing, transmitting actual data read request to TiKV nodes (or TiFlash nodes).
Placement Driver (PD) server
The PD server is the metadata managing component of the entire cluster. It stores metadata of real-time data distribution of every single TiKV node and the topology structure of the entire TiDB cluster, provides the TiDB Dashboard management UI, and allocates transaction IDs to distributed transactions. The PD server is “the brain” of the entire TiDB cluster because it not only stores metadata of the cluster, but also sends data scheduling command to specific TiKV nodes according to the data distribution state reported by TiKV nodes in real time. In addition, the PD server consists of three nodes at least and has high availability. It is recommended to deploy an odd number of PD nodes.
Storage servers
Storage servers
TiKV server
The TiKV server is responsible for storing data. TiKV is a distributed transactional key-value storage engine. Region is the basic unit to store data. Each Region stores the data for a particular Key Range which is a left-closed and right-open interval from StartKey to EndKey. Multiple Regions exist in each TiKV node. TiKV APIs provide native support to distributed transactions at the key-value pair level and supports the Snapshot Isolation level isolation by default. This is the core of how TiDB supports distributed transactions at the SQL level. After processing SQL statements, the TiDB server converts the SQL execution plan to an actual call to the TiKV API. Therefore, data is stored in TiKV. All the data in TiKV is automatically maintained in multiple replicas (three replicas by default), so TiKV has native high availability and supports automatic failover.
TiFlash server
The TiFlash Server is a special type of storage server. Unlike ordinary TiKV nodes, TiFlash stores data by column, mainly designed to accelerate analytical processing.
Prerequisites
Before deploying a TiDB cluster on GCP GKE, make sure the following requirements are satisfied
1) Create a project
2) Enable Kubernetes Engine API
3) Activate Cloud Shell
Ensure that you have the available quote for Compute Engine CPU in your cluster’s region.
4) Configure the GCP service
Configure your GCP project and default region.
gcloud config set core/project
gcloud config set compute/region

Example:
gcloud config set core/project erudite-spot-326413
gcloud config set compute/zone us-west1-a
TiDB Operator uses Custom Resource Definition (CRD) to extend Kubernetes. Therefore, to use TiDB Operator, you must first create the TidbCluster CRD, which is a one-time job in your Kubernetes cluster.
kubectl get pods --namespace tidb-admin -l app.kubernetes.io/instance=tidb-admin
kubectl get pods --namespace tidb-admin -o wide
Deploy a TiDB Cluster and the Monitoring Component
This section describes how to deploy a TiDB cluster and its monitoring services.
Create namespace
kubectl create namespace tidb-cluster
Note: A namespace is a virtual cluster backed by the same physical cluster. This document takes tidb-cluster as an example. If you want to use other namespace, modify the corresponding arguments of -n or –namespace.
Download the sample TidbCluster and TidbMonitor configuration files
Wait until all Pods for all services are started. As soon as you see Pods of each type (-pd, -tikv, and -tidb) are in the “Running” state, you can press Ctrl+C to get back to the command line and go on to connect to your TiDB cluster.
View the cluster status
kubectl get pods -n tidb-cluster
Get list of services in the tidb-cluster
kubectl get svc -n tidb-cluster
Access the TiDB database
After you deploy a TiDB cluster, you can access the TiDB database via MySQL client.
Prepare a bastion host
The LoadBalancer created for your TiDB cluster is an intranet LoadBalancer. You can create a bastion host in the cluster VPC to access the database.
Note: You can also create the bastion host in other zones in the same region.
Note: In the regional cluster, the nodes are created in 3 zones. Therefore, after scaling out, the number of nodes is 2 * 3 = 6.
After that, execute kubectl edit tc basic -n tidb-cluster and modify each component’s replicas to the desired number of replicas. The scaling-out process is then completed.
kubectl edit tc basic -n tidb-cluster
Deploy TiFlash and TiCDC
TiFlash is the columnar storage extension of TiKV.
TiCDC is a tool for replicating the incremental data of TiDB by pulling TiKV change logs.
This blog post describes how to deploy a TiDB cluster on AWS Elastic Kubernetes Service (EKS). TiDB on Kubernetes is the standard way to deploy TiDB on public clouds
Configure AWS Command Line using Security Credentials
Go to AWS Management Console –> Services –> IAM
Select the IAM User: <user>
**Important Note:** Use only IAM user to generate **Security Credentials**. Never ever use Root User. (Highly not recommended)
Click on **Security credentials** tab
Click on **Create access key**
Copy Access ID and Secret access key
Go to command line and provide the required details
aws configure
Test if AWS CLI is working after configuring the above:
aws ec2 describe-vpcs
Install kubectl CLI
Kubectl binaries for EKS please prefer to use from Amazon
This will help us to get the exact Kubectl client version based on our EKS Cluster version. You can use the below documentation link to download the binary.
# Download the Package
mkdir kubectlbinary
cd kubectlbinary
curl -o kubectl https://amazon-eks.s3.us-west-2.amazonaws.com/1.16.8/2020-04-16/bin/darwin/amd64/kubectl
# Provide execute permissions
chmod +x ./kubectl
# Set the Path by copying to user Home Directory
mkdir -p $HOME/bin && cp ./kubectl $HOME/bin/kubectl && export PATH=$PATH:$HOME/bin
echo 'export PATH=$PATH:$HOME/bin' >> ~/.bash_profile
# Verify the kubectl version
kubectl version --short --client
Output: Client Version: v1.16.8-eks-e16311
mkdir kubectlbinary
cd kubectlbinary
curl -o kubectl.exe https://amazon-eks.s3.us-west-2.amazonaws.com/1.16.8/2020-04-16/bin/windows/amd64/kubectl.exe
```
- Update the system **Path** environment variable
```
# Verify the kubectl client version
kubectl version --short --client
kubectl version --client
Install eksctl CLI
eksctl on Mac
# Install Homebrew on MacOs
/bin/bash -c "$(curl -fsSL https://raw.githubusercontent.com/Homebrew/install/master/install.sh)"
# Install the Weaveworks Homebrew tap.
brew tap weaveworks/tap
# Install the Weaveworks Homebrew tap.
brew install weaveworks/tap/eksctl
# Verify eksctl version
eksctl version
eksctl on windows or linux
For windows and linux OS, you can refer below documentation link.
TiDB is designed to consist of multiple components. These components communicate with each other and form a complete TiDB system. The architecture is as follows:
TiDB server
The TiDB server is a stateless SQL layer that exposes the connection endpoint of the MySQL protocol to the outside. The TiDB server receives SQL requests, performs SQL parsing and optimization, and ultimately generates a distributed execution plan. It is horizontally scalable and provides the unified interface to the outside through the load balancing components such as Linux Virtual Server (LVS), HAProxy, or F5. It does not store data and is only for computing and SQL analyzing, transmitting actual data read request to TiKV nodes (or TiFlash nodes).
Placement Driver (PD) server
The PD server is the metadata managing component of the entire cluster. It stores metadata of real-time data distribution of every single TiKV node and the topology structure of the entire TiDB cluster, provides the TiDB Dashboard management UI, and allocates transaction IDs to distributed transactions. The PD server is “the brain” of the entire TiDB cluster because it not only stores metadata of the cluster, but also sends data scheduling command to specific TiKV nodes according to the data distribution state reported by TiKV nodes in real time. In addition, the PD server consists of three nodes at least and has high availability. It is recommended to deploy an odd number of PD nodes.
Storage servers
TiKV server
The TiKV server is responsible for storing data. TiKV is a distributed transactional key-value storage engine. Region is the basic unit to store data. Each Region stores the data for a particular Key Range which is a left-closed and right-open interval from StartKey to EndKey. Multiple Regions exist in each TiKV node. TiKV APIs provide native support to distributed transactions at the key-value pair level and supports the Snapshot Isolation level isolation by default. This is the core of how TiDB supports distributed transactions at the SQL level. After processing SQL statements, the TiDB server converts the SQL execution plan to an actual call to the TiKV API. Therefore, data is stored in TiKV. All the data in TiKV is automatically maintained in multiple replicas (three replicas by default), so TiKV has native high availability and supports automatic failover.
TiFlash server
The TiFlash Server is a special type of storage server. Unlike ordinary TiKV nodes, TiFlash stores data by column, mainly designed to accelerate analytical processing.
Create a EKS cluster and a node pool
It is recommended to create a node pool in each availability zone (at least 3 in total) for each component when creating an EKS.
This section describes how to deploy a TiDB Operator on AWS EKS.
Install Helm (Prerequisite)
MAC – Install Helm
brew install helm
Windows 10 – Install Helm
choco install kubernetes-helm
Create CRD
TiDB Operator uses Custom Resource Definition (CRD) to extend Kubernetes. Therefore, to use TiDB Operator, you must first create the TidbCluster CRD, which is a one-time job in your Kubernetes cluster.
Create a file called crd.yaml. Copy the configuration from the link below.
To confirm that the TiDB Operator components are running, execute the following command:
kubectl get pods --namespace tidb-admin -l app.kubernetes.io/instance=tidb-operator
Deploy a TiDB cluster and the Monitoring Component
This section describes how to deploy a TiDB cluster and its monitoring component in AWS EKS.
Create namespace
kubectl create namespace tidb-cluster
Note: A namespace is a virtual cluster backed by the same physical cluster. This document takes tidb-cluster as an example. If you want to use a different namespace, modify the corresponding arguments of -n or –namespace.
Deploy
Download the sample TidbCluster and TidbMonitor configuration files:
After the yaml file above is applied to the Kubernetes cluster, TiDB Operator creates the desired TiDB cluster and its monitoring component according to the yaml file.
Verify Cluster & Nodes
View cluster status
kubectl get pods -n tidb-cluster
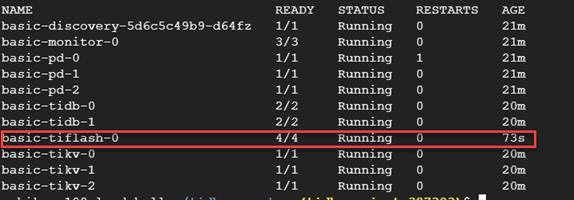
When all the Pods are in the Running or Ready state, the TiDB cluster is successfully started.
List worker nodes
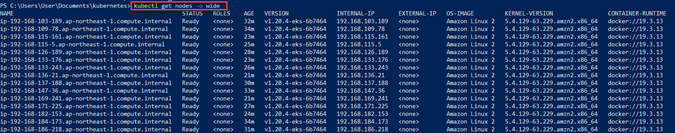
List Nodes in current kubernetes cluster
kubectl get nodes -o wide
Verify Cluster, NodeGroup in EKS Management Console
Go to Services -> Elastic Kubernetes Service -> ${clustername}
Verify Worker Node IAM Role and list of Policies
Go to Services -> EC2 -> Worker Nodes
Verify CloudFormation Stacks
Verify Control Plane Stack & Events
Verify NodeGroup Stack & Events
Below are the associated NodeGroup Events
Access the Database
You can access the TiDB database to test or develop your application after you have deployed a TiDB cluster.
Prepare a bastion host
The LoadBalancer created for your TiDB cluster is an intranet LoadBalancer. You can create a bastion host in the cluster VPC to access the database.
Select the cluster’s VPC and Subnet and verify whether the cluster name is correct in the dropdown box.
You can view the cluster’s VPC and Subnet by running the following command:
eksctl get cluster -n tidbcluster -r ap-northeast-1
Allow the bastion host to access the Internet. Select the correct key pair so that you can log in to the host via SSH.
Install the MySQL client and connect
sudo yum install mysql -y
Connect the client to the TiDB cluster
mysql -h ${tidb-nlb-dnsname} -P 4000 -u root
kubectl get svc basic-tidb -n tidb-cluster
${tidb-nlb-dnsname} is the LoadBalancer domain name of the TiDB service. You can view the domain name in the EXTERNAL-IP field by executing kubectl get svc basic-tidb -n tidb-cluster.
kubectl get svc basic-tidb -n tidb-cluster
Check TiDB version
select tidb_version()\G
Create test table
use test;

create table test_table (id int unsigned not null auto_increment primary key, v varchar(32));
select * from information_schema.tikv_region_status where db_name=database() and table_name='test_table'\G
In the output below, the EXTERNAL-IP column is the LoadBalancer domain name.
You can access the ${grafana-lb}:3000 address using your web browser to view monitoring metrics. Replace ${grafana-lb} with the LoadBalancer domain name.
Upgrade
To upgrade the TiDB cluster, edit the spec.version by executing the command below.
kubectl edit tc basic -n tidb-cluster
Scale out
Before scaling out the cluster, you need to scale out the corresponding node group so that the new instances have enough resources for operation.
This section describes how to scale out the EKS node group and TiDB components.
Scale out EKS node group
When scaling out TiKV, the node groups must be scaled out evenly among the different availability zones. The following example shows how to scale out the tikv-1a, tikv-1c, and tikv-1d groups of the ${clusterName} cluster to 2 nodes.
After scaling out the EKS node group, execute kubectl edit tc basic -n tidb-cluster, and modify each component’s replicas to the desired number of replicas. The scaling-out process is then completed.
Deploy TiFlash/TiCDC
TiFlash is the columnar storage extension of TiKV.
TiCDC is a tool for replicating the incremental data of TiDB by pulling TiKV change logs.
In the configuration file of eksctl (cluster.yaml), add the following two items to add a node group for TiFlash/TiCDC respectively. desiredCapacity is the number of nodes you desire.
Depending on the EKS cluster status, use different commands:
If the cluster is not created, execute eksctl create cluster -f cluster.yaml to create the cluster and node groups.
If the cluster is already created, execute eksctl create nodegroup -f cluster.yaml to create the node groups. The existing node groups are ignored and will not be created again.
Deploy TiFlash/TiCDC
To deploy TiFlash, configure spec.tiflash in tidb-cluster.yaml:
This command closes all open tables and locks all tables for all databases with a global read lock
FLUSH TABLES or RELOAD privilege is required for this operation.
To release the lock, use UNLOCK TABLES. This command implicitly commits any active transaction only if any tables currently have been locked with LOCK TABLES.
Inserting rows into the log tables is not prevented with FLUSH TABLES WITH READ LOCK.
The amount of resources that can be used can be controlled from the operating system perspective. Each user has limits that are set, but for that particular user, the limits are applied individually to each of its processes.
Limits can either be hard or soft. Only the root user can set the Hardlimits. Other users can set Soft limits, but it cannot be more than the hard limit.
The default value of ulimit open files limit is 1024. This is very low for a typical web server environment that hosts many have database-driven sites.
MySQL/MariaDB also uses this setting. The open_files_limit is set by MySQL/MariaDB to the system’s ulimit. Default is 1024.
NOTE: MySQL/MariaDB can only set its open_files_limit lower than what is specified under ulimit ‘open files’. It cannot be set higher than that.
Examine Current Limits
To inspect current limits
ulimit -a

# -a will show all current limits including hard, soft, open files, etc.
To inspect the current hard and soft limits.
# Hard Limits
ulimit -Ha

# Soft Limits
ulimit -Sa

# H for hard limits, or S for soft limits.
To check current open file limits.
ulimit -n

# –n for number of open files limits
Set ‘open files’ Limit Persistently
Open /etc/security/limits.conf using the text editor of your choice, and add the following lines, then save it.
* soft nofile 102400
* hard nofile 102400
* soft nproc 10240
* hard nproc 10240
Edit the file /etc/security/limits.d/90-nproc.conf using the text editor of your choice, and add the following lines, then save it.
* soft nofile 1024000
* hard nofile 1024000
* soft nproc 10240
* hard nproc 10240
root soft nproc unlimited
Set open_files_limit in my.cnf (MySQL)
Open and edit /etc/my.cnf
Insert the lines below under [mysql], then save it.
[mysqld]
open_files_limit = 102400
Run the command below to see if there are any .conf files being used by MySQL that overrides the values for open limits.
systemctl status mysqld
Below is something you will see after running the command above.