This blog post describes how to deploy a TiDB cluster on GCP Google Kubernetes Engine (GKE). TiDB on Kubernetes is the standard way to deploy TiDB on public clouds.
TiDB Architecture
TiDB is designed to consist of multiple components. These components communicate with each other and form a complete TiDB system. The architecture is as follows:

TiDB server
The TiDB server is a stateless SQL layer that exposes the connection endpoint of the MySQL protocol to the outside. The TiDB server receives SQL requests, performs SQL parsing and optimization, and ultimately generates a distributed execution plan. It is horizontally scalable and provides the unified interface to the outside through the load balancing components such as Linux Virtual Server (LVS), HAProxy, or F5. It does not store data and is only for computing and SQL analyzing, transmitting actual data read request to TiKV nodes (or TiFlash nodes).
Placement Driver (PD) server
The PD server is the metadata managing component of the entire cluster. It stores metadata of real-time data distribution of every single TiKV node and the topology structure of the entire TiDB cluster, provides the TiDB Dashboard management UI, and allocates transaction IDs to distributed transactions. The PD server is “the brain” of the entire TiDB cluster because it not only stores metadata of the cluster, but also sends data scheduling command to specific TiKV nodes according to the data distribution state reported by TiKV nodes in real time. In addition, the PD server consists of three nodes at least and has high availability. It is recommended to deploy an odd number of PD nodes.
Storage servers
Storage servers
TiKV server
The TiKV server is responsible for storing data. TiKV is a distributed transactional key-value storage engine. Region is the basic unit to store data. Each Region stores the data for a particular Key Range which is a left-closed and right-open interval from StartKey to EndKey. Multiple Regions exist in each TiKV node. TiKV APIs provide native support to distributed transactions at the key-value pair level and supports the Snapshot Isolation level isolation by default. This is the core of how TiDB supports distributed transactions at the SQL level. After processing SQL statements, the TiDB server converts the SQL execution plan to an actual call to the TiKV API. Therefore, data is stored in TiKV. All the data in TiKV is automatically maintained in multiple replicas (three replicas by default), so TiKV has native high availability and supports automatic failover.
TiFlash server
The TiFlash Server is a special type of storage server. Unlike ordinary TiKV nodes, TiFlash stores data by column, mainly designed to accelerate analytical processing.
Prerequisites
Before deploying a TiDB cluster on GCP GKE, make sure the following requirements are satisfied
1) Create a project


3) Activate Cloud Shell

Ensure that you have the available quote for Compute Engine CPU in your cluster’s region.
4) Configure the GCP service
Configure your GCP project and default region.

gcloud config set core/projectgcloud config set compute/region Example: gcloud config set core/project erudite-spot-326413 gcloud config set compute/zone us-west1-a
Create a GKE cluster and node pool
Enable container.googleapis.com
gcloud services enable container.googleapis.com
Create a GKE cluster and a default node pool
gcloud container clusters create tidb --region us-west1-a --machine-type n1-standard-4 --num-nodes=1
Create separate node pools for PD, TiKV, and TiDB
gcloud container node-pools create pd --cluster tidb --machine-type n1-standard-4 --num-nodes=1 \
--node-labels=dedicated=pd --node-taints=dedicated=pd:NoSchedule

gcloud container node-pools create tikv --cluster tidb --machine-type n1-highmem-8 --num-nodes=1 \
--node-labels=dedicated=tikv --node-taints=dedicated=tikv:NoSchedule

gcloud container node-pools create tidb --cluster tidb --machine-type n1-standard-8 --num-nodes=1 \
    --node-labels=dedicated=tidb --node-taints=dedicated=tidb:NoSchedule
Deploy TiDB Operator
This section describes how to deploy a TiDB Operator on GCP GKE
Install Helm
Helm is used for deploying TiDB Operator
curl -fsSL -o get_helm.sh https://raw.githubusercontent.com/helm/helm/master/scripts/get-helm-3
chmod 700 get_helm.sh
./get_helm.sh
git clone https://github.com/pingcap/tidb-operator.git && cd tidb-operator &&
kubectl create serviceaccount tiller --namespace kube-system &&
kubectl apply -f ./manifests/tiller-rbac.yaml &&
helm init --service-account tiller --upgrade
Helm will also need a couple of permissions to work properly. We can download them from the tidb-operator project.

Ensure that the tiller pod is running.
kubectl get pods -n kube-system

Note: If it is not running (Status: ImagePullBackOff), then run the following commands. Then check the status again.
kubectl delete -n kube-system deployment tiller-deploy

helm init --service-account tiller --upgrade
Install TiDB Operator CRDs
TiDB Operator uses Custom Resource Definition (CRD) to extend Kubernetes. Therefore, to use TiDB Operator, you must first create the TidbCluster CRD, which is a one-time job in your Kubernetes cluster.
kubectl apply -f https://raw.githubusercontent.com/pingcap/tidb-operator/master/manifests/crd.yaml

Add the PingCAP repository
helm repo add pingcap https://charts.pingcap.org/

Create a namespace for TiDB Operator
kubectl create namespace tidb-admin
Install TiDB Operator
helm install ./charts/tidb-operator -n tidb-admin --namespace=tidb-admin --version v1.2.3

Make sure tidb-operator components are running.
kubectl get pods --namespace tidb-admin -l app.kubernetes.io/instance=tidb-admin

kubectl get pods --namespace tidb-admin -o wide

Deploy a TiDB Cluster and the Monitoring Component
This section describes how to deploy a TiDB cluster and its monitoring services.
Create namespace
kubectl create namespace tidb-cluster
Note: A namespace is a virtual cluster backed by the same physical cluster. This document takes tidb-cluster as an example. If you want to use other namespace, modify the corresponding arguments of -n or –namespace.
Download the sample TidbCluster and TidbMonitor configuration files
curl -O https://raw.githubusercontent.com/pingcap/tidb-operator/master/examples/gcp/tidb-cluster.yaml && \
curl -O https://raw.githubusercontent.com/pingcap/tidb-operator/master/examples/gcp/tidb-monitor.yaml
Deploy the TidbCluster and TidbMonitor CR in the GKE cluster
kubectl create -f tidb-cluster.yaml -n tidb-cluster && \
kubectl create -f tidb-monitor.yaml -n tidb-cluster

Watch Cluster Status
watch kubectl get pods -n tidb-cluster
Wait until all Pods for all services are started. As soon as you see Pods of each type (-pd, -tikv, and -tidb) are in the “Running” state, you can press Ctrl+C to get back to the command line and go on to connect to your TiDB cluster.
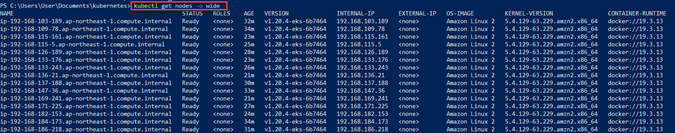
View the cluster status
kubectl get pods -n tidb-cluster

Get list of services in the tidb-cluster
kubectl get svc -n tidb-cluster
Access the TiDB database
After you deploy a TiDB cluster, you can access the TiDB database via MySQL client.
Prepare a bastion host
The LoadBalancer created for your TiDB cluster is an intranet LoadBalancer. You can create a bastion host in the cluster VPC to access the database.
Note: You can also create the bastion host in other zones in the same region.
gcloud compute instances create bastion \
    --machine-type=n1-standard-4 \
    --image-project=centos-cloud \
    --image-family=centos-7 \
    --zone=us-west1-a

Install the MySQL client and Connect
After the bastion host is created, you can connect to the bastion host via SSH and access the TiDB cluster via the MySQL client.
Connect to the bastion host via SSH.
gcloud compute ssh tidb@bastion

Install the MySQL Client.
sudo yum install mysql -y
Connect the client to the TiDB cluster
mysql -h ${tidb-nlb-dnsname} -P 4000 -u root
${tidb-nlb-dnsname} is the LoadBalancer IP of the TiDB service.
You can view the IP in the EXTERNAL-IP field of the kubectl get svc basic-tidb -n tidb-cluster execution result.
kubectl get svc basic-tidb -n tidb-cluster

mysql -h 10.138.0.6 -P 4000 -u root

Check TiDB Version
select tidb_version()\G

Create Test table
use test;

create table test_table (id int unsigned not null auto_increment primary key, v varchar(32));
select * from information_schema.tikv_region_status where db_name=database() and table_name='test_table'\G

Query the TiKV store status
select * from information_schema.tikv_store_status\G

Query the TiDB cluster information
select * from information_schema.cluster_info\G

Access the Grafana Monitor Dashboard
Obtain the LoadBalancer IP of Grafana
kubectl -n tidb-cluster get svc basic-grafana

In the output above, the EXTERNAL-IP column is the LoadBalancer IP.
You can access the ${grafana-lb}:3000 address using your web browser to view monitoring metrics. Replace ${grafana-lb} with the LoadBalancer IP.


Scale out
Before scaling out the cluster, you need to scale out the corresponding node pool so that the new instances have enough resources for operation.
This section describes how to scale out the EKS node group and TiDB components.
Scale out GKE node group
| gcloud container clusters resize tidb –node-pool tikv –num-nodes 2 |
The following example shows how to scale out the tikv node pool of the tidb cluster to 6 nodes:
gcloud container clusters resize tidb --node-pool tikv --num-nodes 2
Note: In the regional cluster, the nodes are created in 3 zones. Therefore, after scaling out, the number of nodes is 2 * 3 = 6.
After that, execute kubectl edit tc basic -n tidb-cluster and modify each component’s replicas to the desired number of replicas. The scaling-out process is then completed.
kubectl edit tc basic -n tidb-cluster
Deploy TiFlash and TiCDC
TiFlash is the columnar storage extension of TiKV.
TiCDC is a tool for replicating the incremental data of TiDB by pulling TiKV change logs.
Create new node pools
- Create a node pool for TiFlash:
gcloud container node-pools create tiflash --cluster tidb --machine-type n1-highmem-8 --num-nodes=1 \
    --node-labels dedicated=tiflash --node-taints dedicated=tiflash:NoSchedule
- Create a node pool for TiCD
gcloud container node-pools create ticdc --cluster tidb --machine-type n1-standard-4 --num-nodes=1 \
    --node-labels dedicated=ticdc --node-taints dedicated=ticdc:NoSchedule
Configure and deploy
- To deploy TiFlash, configure spec.tiflash in tidb-cluster.yaml.
  tiflash:
    baseImage: pingcap/tiflash
    replicas: 1
    storageClaims:
    - resources:
        requests:
          storage: 100Gi
    nodeSelector:
      dedicated: tiflash
    tolerations:
    - effect: NoSchedule
      key: dedicated
      operator: Equal
      value: tiflash
- To deploy TiCDC, configure spec.ticdc in tidb-cluster.yaml
ticdc:
    baseImage: pingcap/ticdc
    replicas: 1
    nodeSelector:
      dedicated: ticdc
    tolerations:
    - effect: NoSchedule
      key: dedicated
      operator: Equal
      value: ticdc
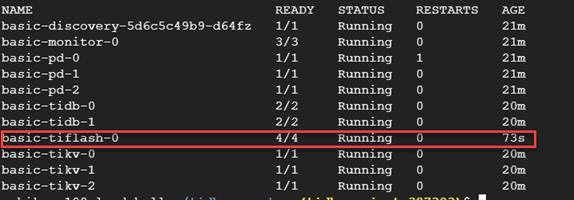
- Finally, execute kubectl -n tidb-cluster apply -f tidb-cluster.yaml to update the TiDB cluster configuration
kubectl -n tidb-cluster apply -f tidb-cluster.yaml
Delete Cluster
List existing clusters for running containers
gcloud container clusters list

Delete cluster.
gcloud container clusters delete tidb

Cheers!